01 The problem
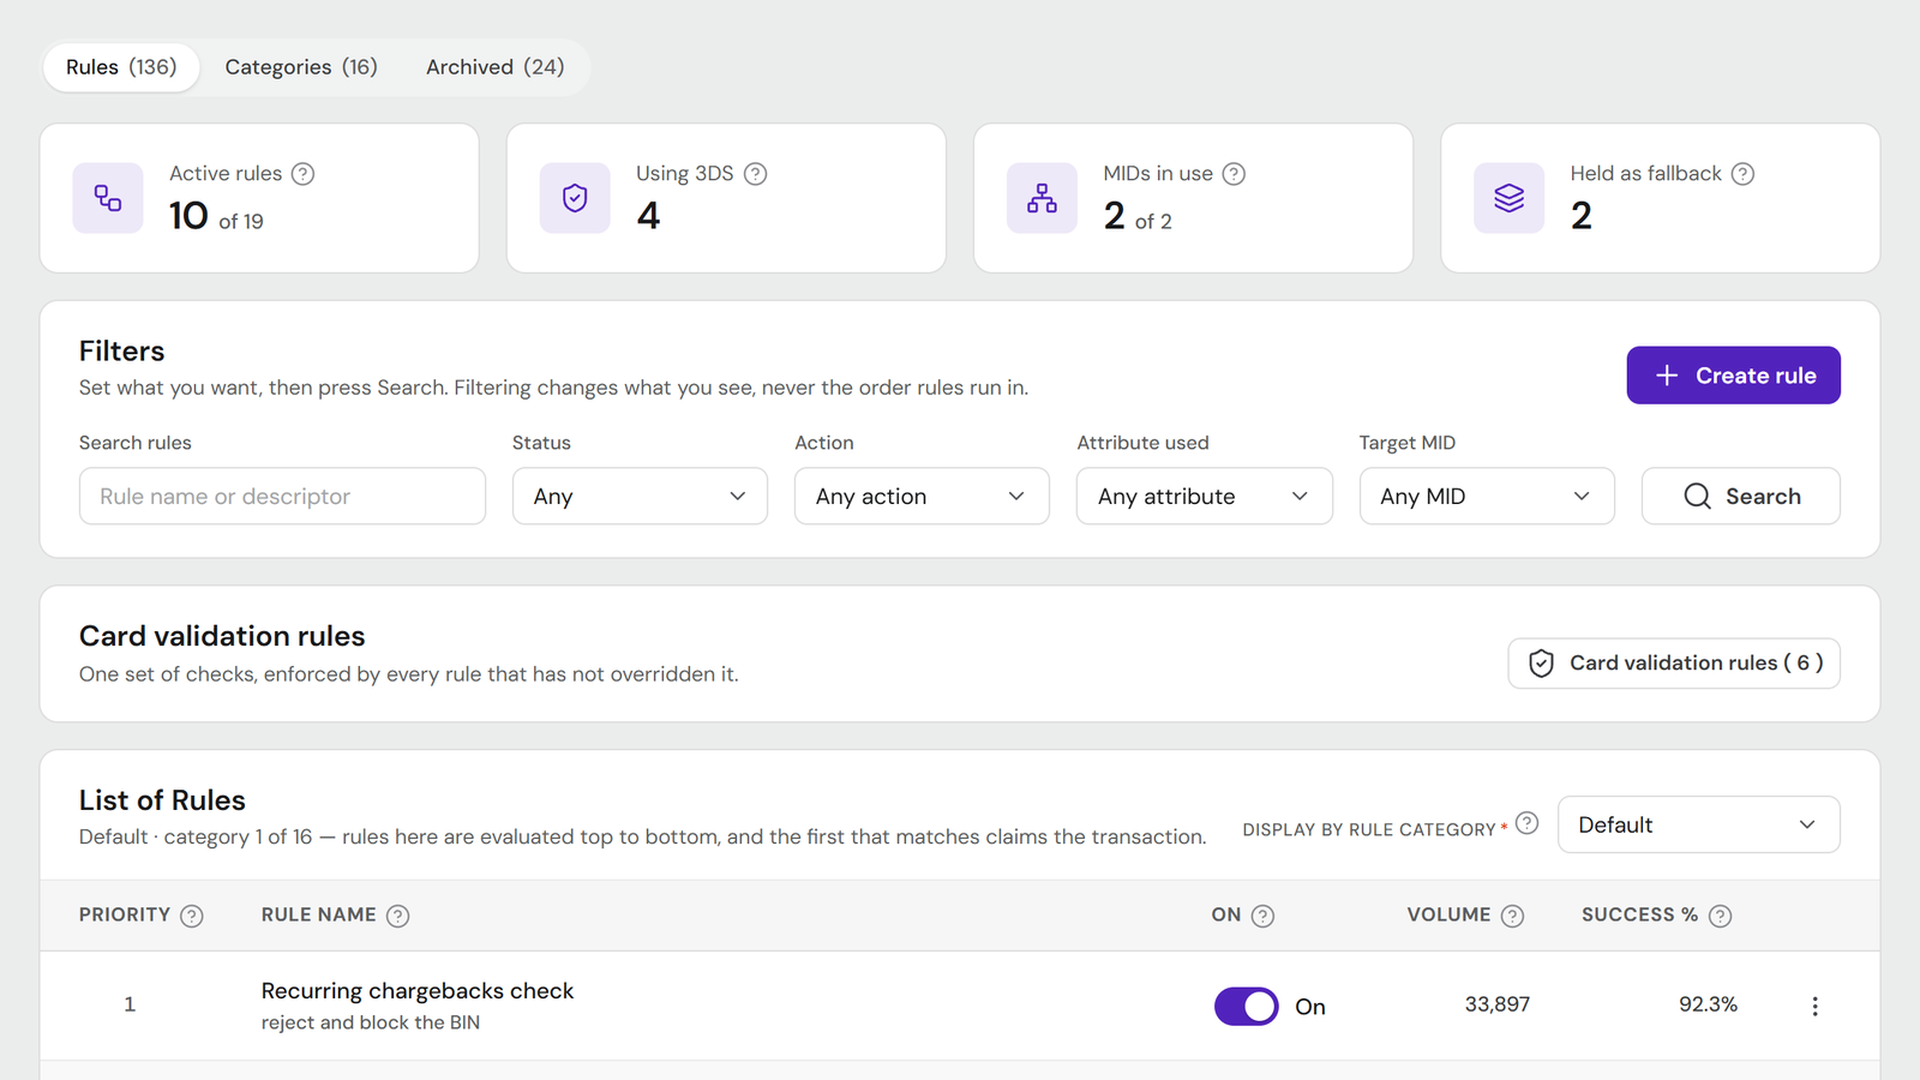
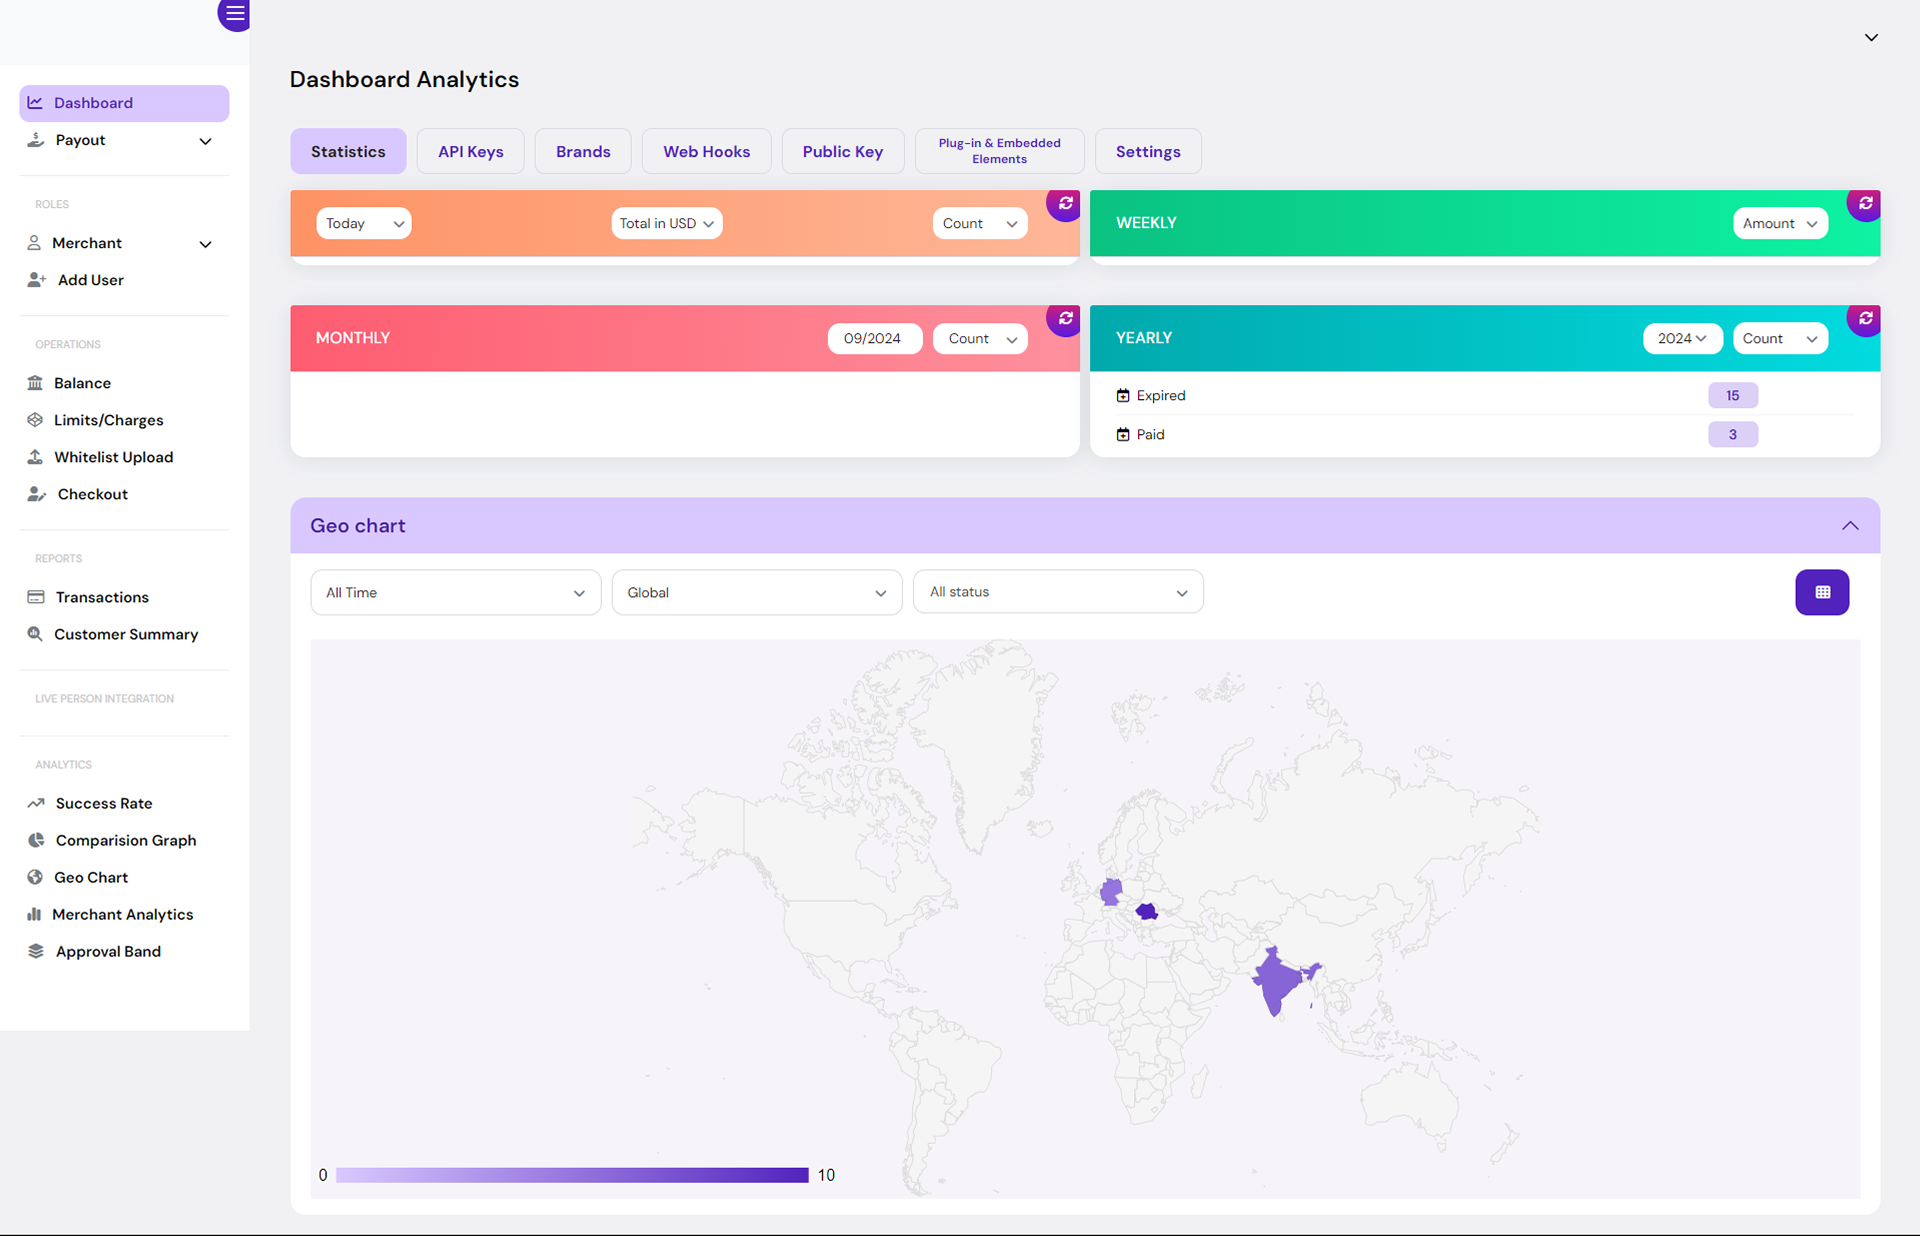
It counted activity, not success
You could see that four hundred transactions happened. You could not see that a third of them failed, which payment method was failing, or in which country.
02 The users
Approval falls overnight. They should hear it here first.
The person who opens this is a payments lead at a mid-size operator. It is the first screen they look at, because approval rate falling overnight is money already lost by the time anyone picks up the phone.
What they are trying to avoid is finding out from somebody else — a customer complaint, a provider's status page, an email from us. The dashboard is the tool that is supposed to tell them first.
03 The changes
What I changed, and why
-
Old
Counts answered “how much”, not “is this working”.
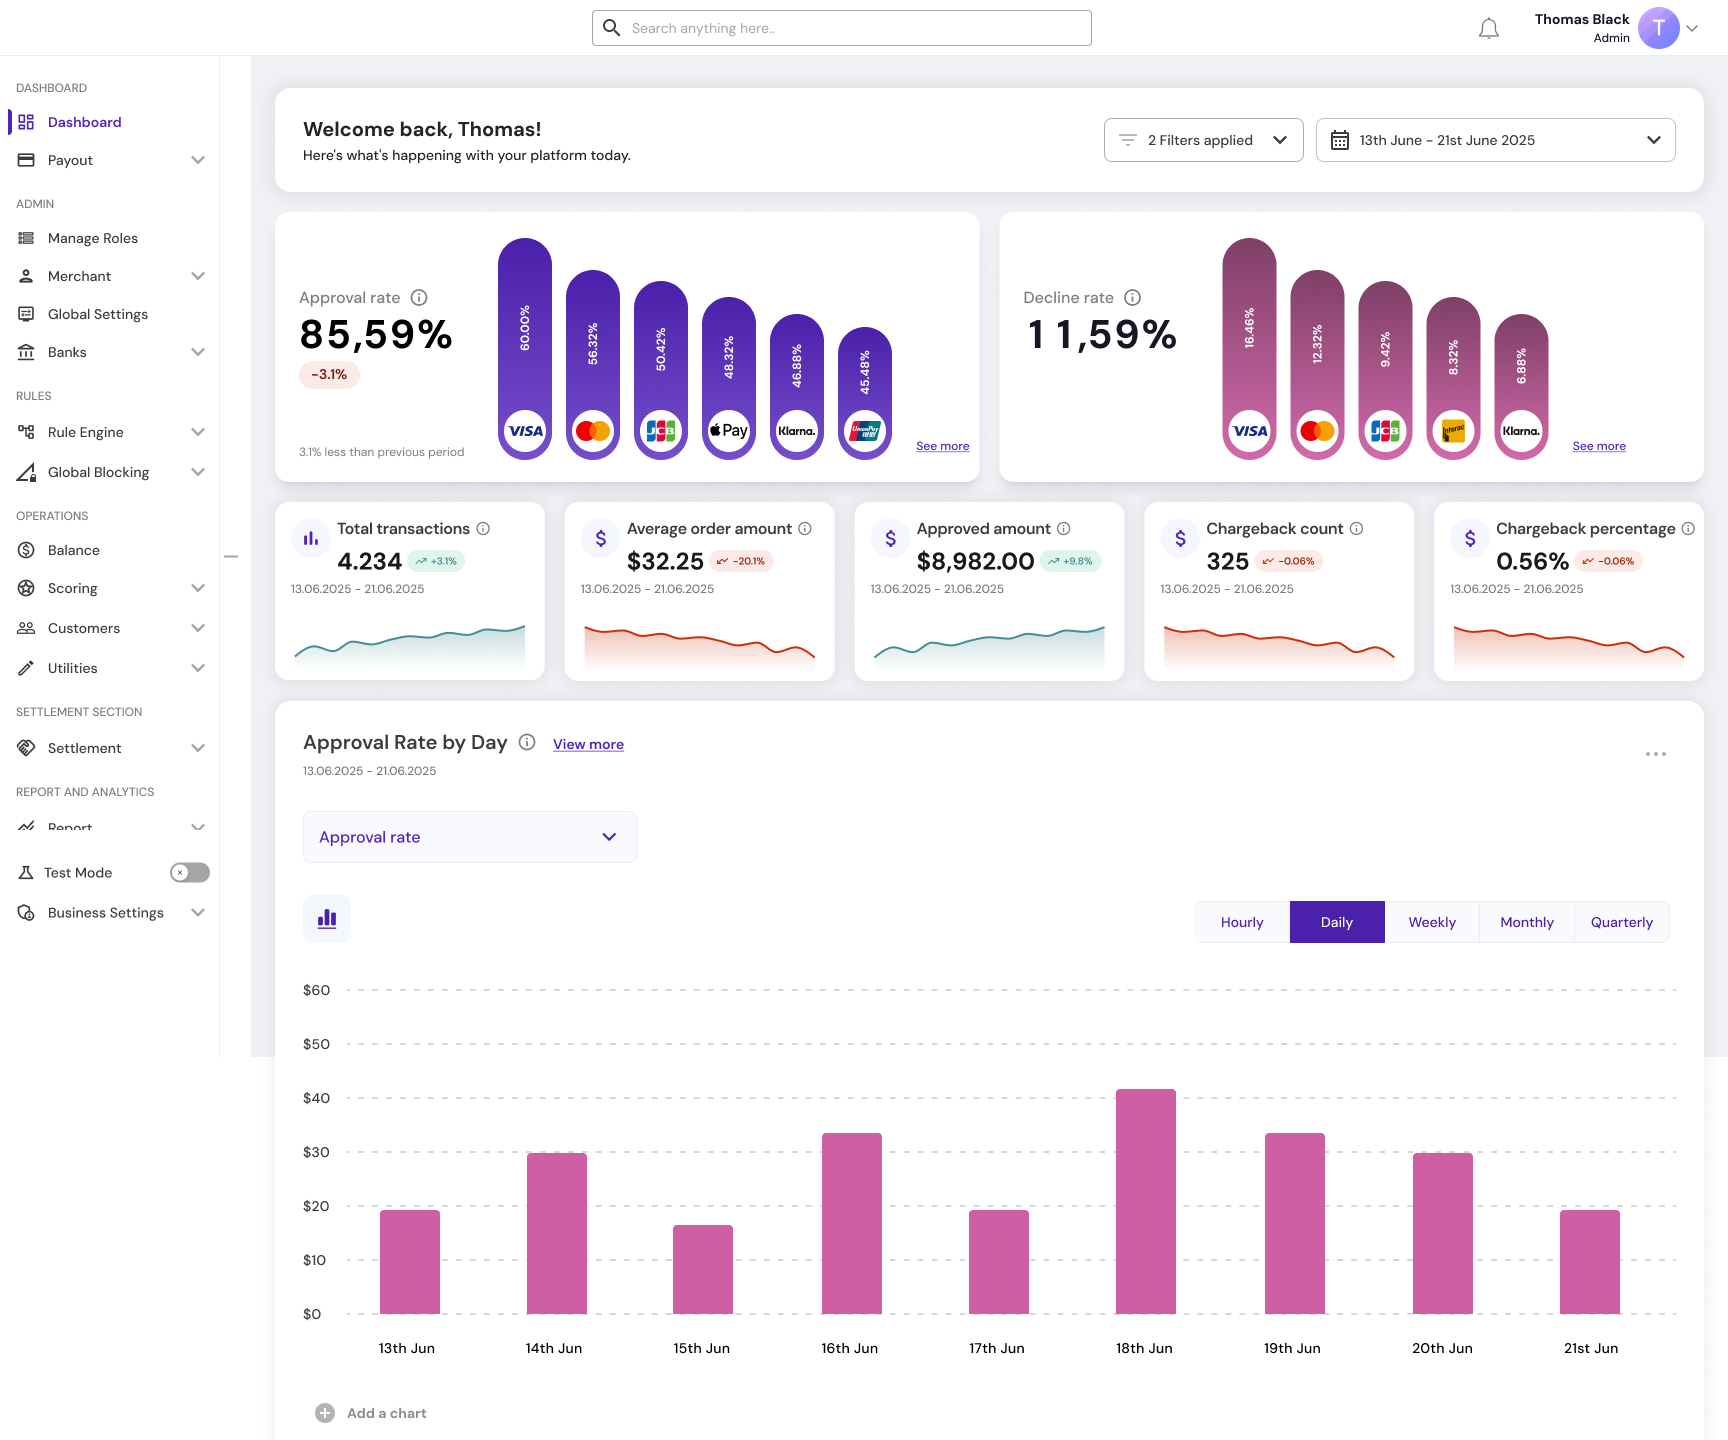
NewLed with approval rate and decline rate, each broken down by payment method, so a drop can be traced to its cause at a glance.

Fig. 02 — Each headline rate carries its own breakdown by payment method, so a drop in approval can be attributed at a glance rather than only noticed. View full screen -
Old
Four panels showed the same metric at four time ranges, in four different colours.
NewOne row of metrics under a shared date range, each with a trend line, so the comparison is between metrics rather than between periods of the same one.

Fig. 03 — Five different measures over one date range. The period is set once for the whole screen, so the cards can be read against each other. View full screen -
Old
Colour was decoration — orange, green, red and teal panels with nothing attached to them.
NewColour has a job wherever it appears. Green and red mark only the direction of change against the previous period, on the trend badges and sparklines.
-
Old
Two of the four panels rendered empty, with no explanation.
NewExplicit empty states that say what is missing and offer a retry.
-
Old
A geo chart showed where transactions came from, but not how they performed.
NewA region table with approved amount, average order value, chargeback rate and volume share per country, so a bad market can be found, not just a busy one.
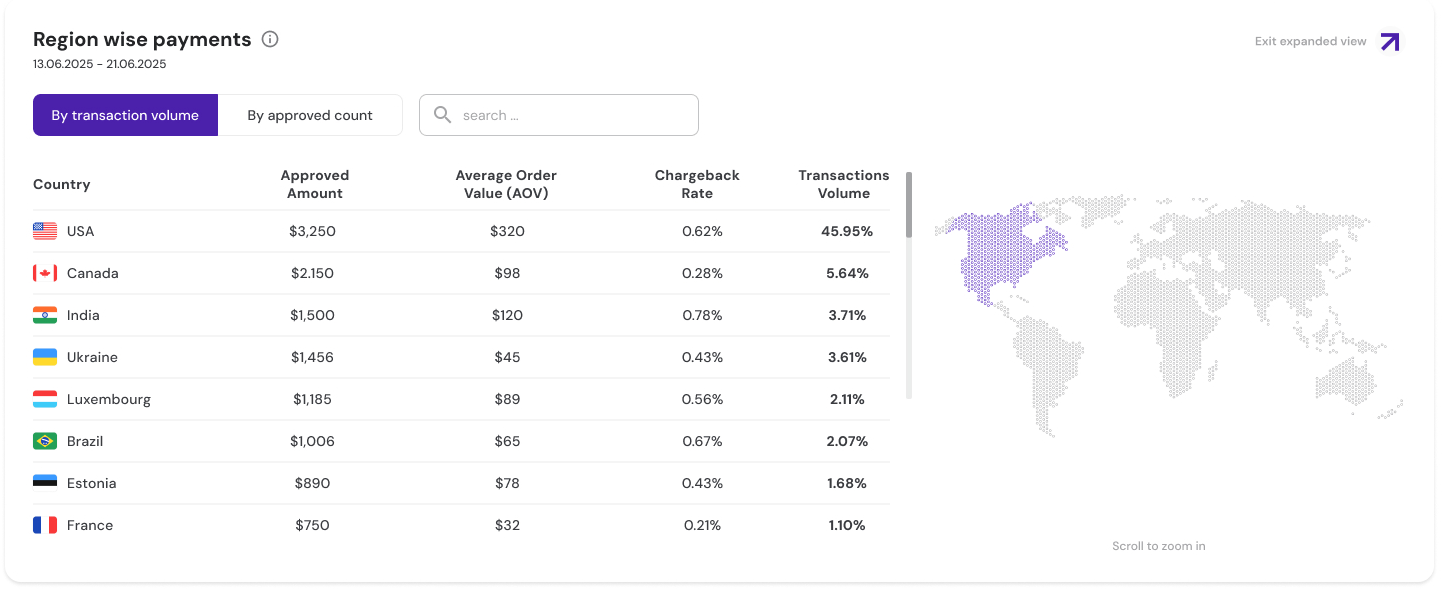
Fig. 04 — The map stayed, but the table does the work. A country with high volume and a high chargeback rate reads as a problem here, where the old map could only show it as busy. View full screen -
Old
Nothing showed how the payment providers were performing.
NewA PSP performance table with approval rate and volume per provider, and a MID-level summary per bank.
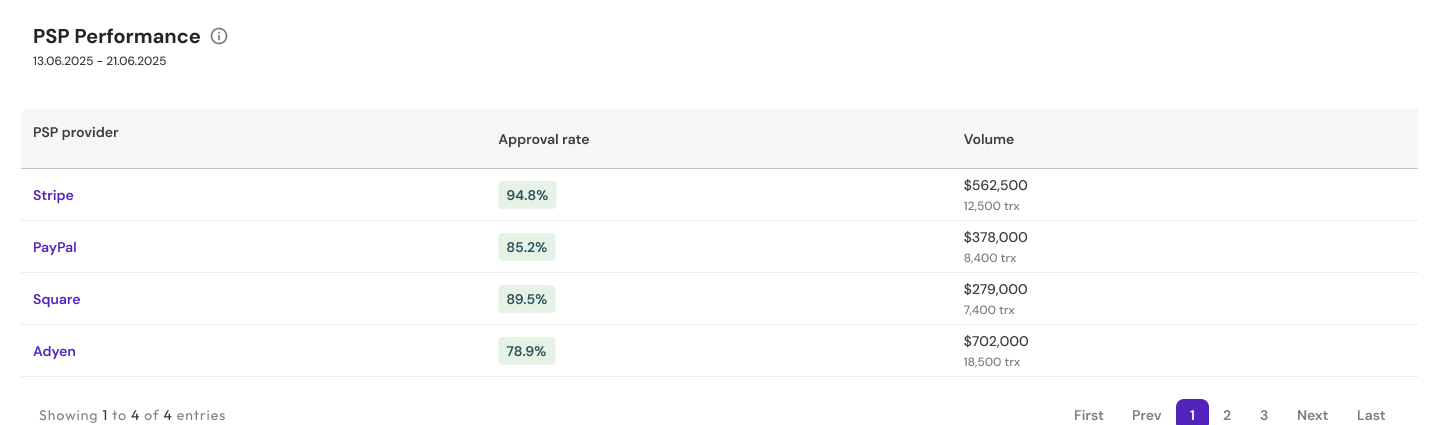
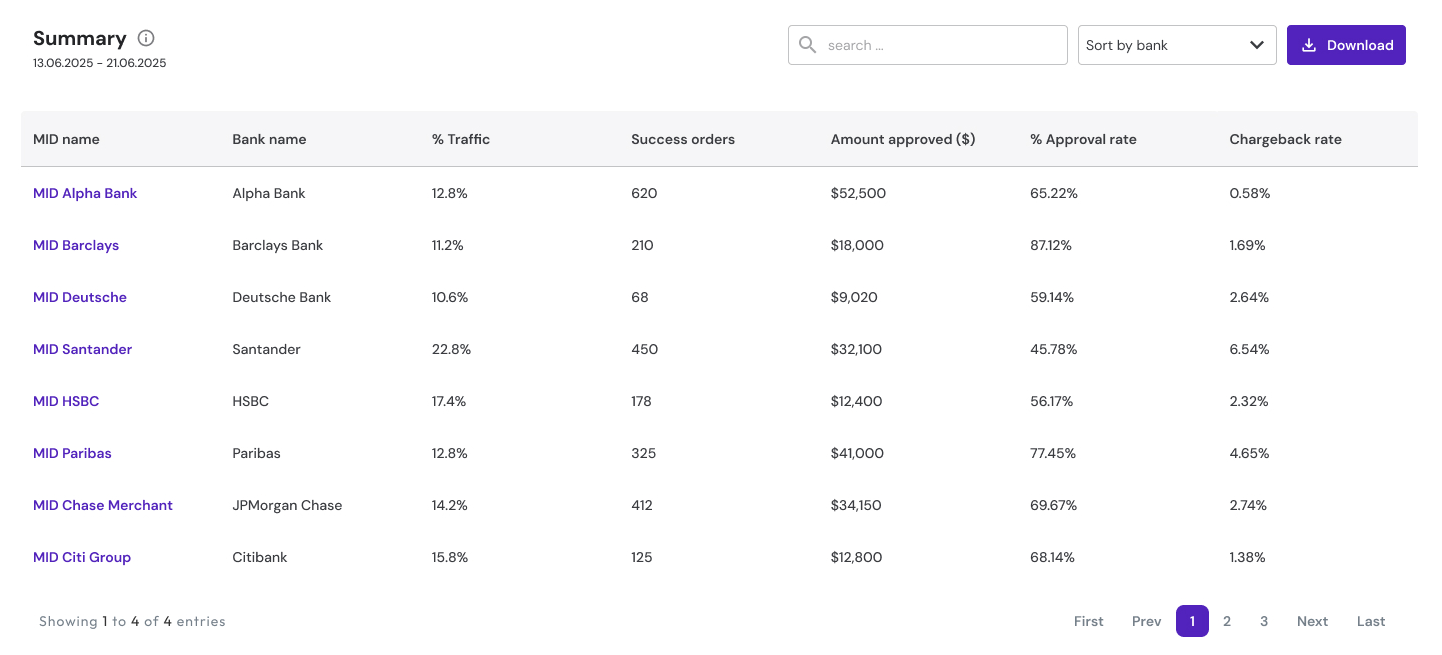
Fig. 05 — Provider performance and the MID summary below it. When approval drops, these tables are where an operator finds out whether one provider or one bank account is responsible. View full screen: provider table · MID summary
04 Diagnosis
Approval is down. Where do you look?
This is the flow the dashboard was designed for, not a recorded incident.
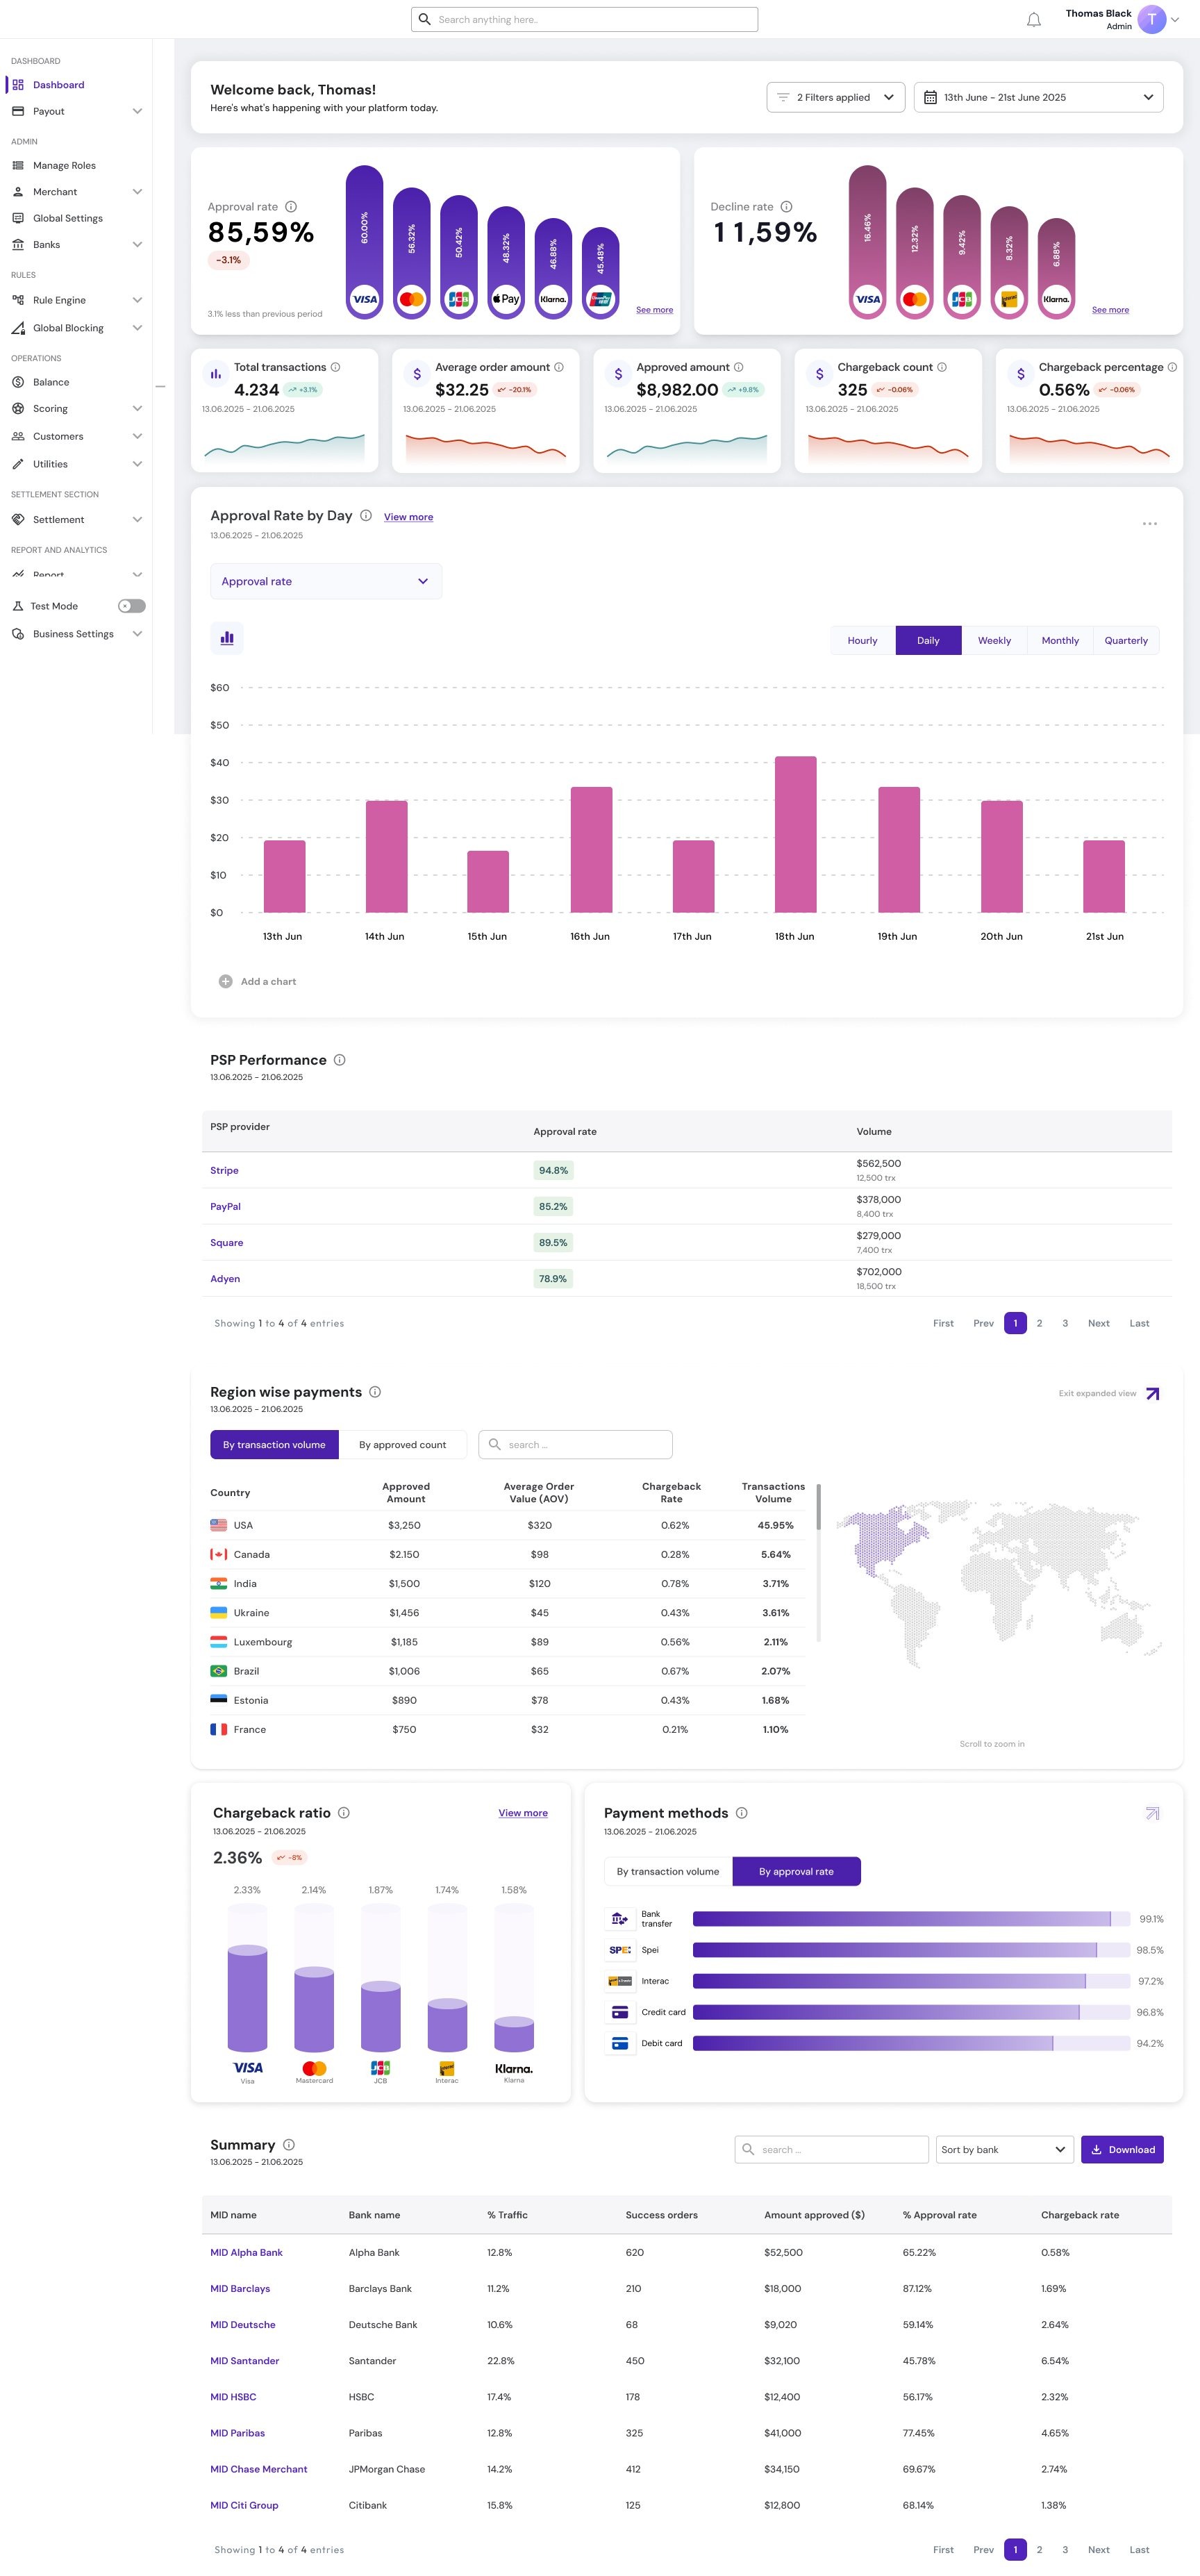
- The approval card reads 85.59%, down 3.1% on the previous period — both sample figures from the design — and its bars break that rate down by payment method, so the method that dropped is visible straight away.
- The PSP performance table shows whether one provider is behind it: approval rate and volume, provider by provider.
- The region table shows whether it is one market: approved amount, average order value, chargeback rate and volume share, country by country.
- The MID summary narrows it to a bank and a MID.
On the old dashboard the same question ended at “transactions are down,” with four coloured panels and no way to ask why.
05 Iterations
More data first, then less on purpose
-
v1 → v2 · density
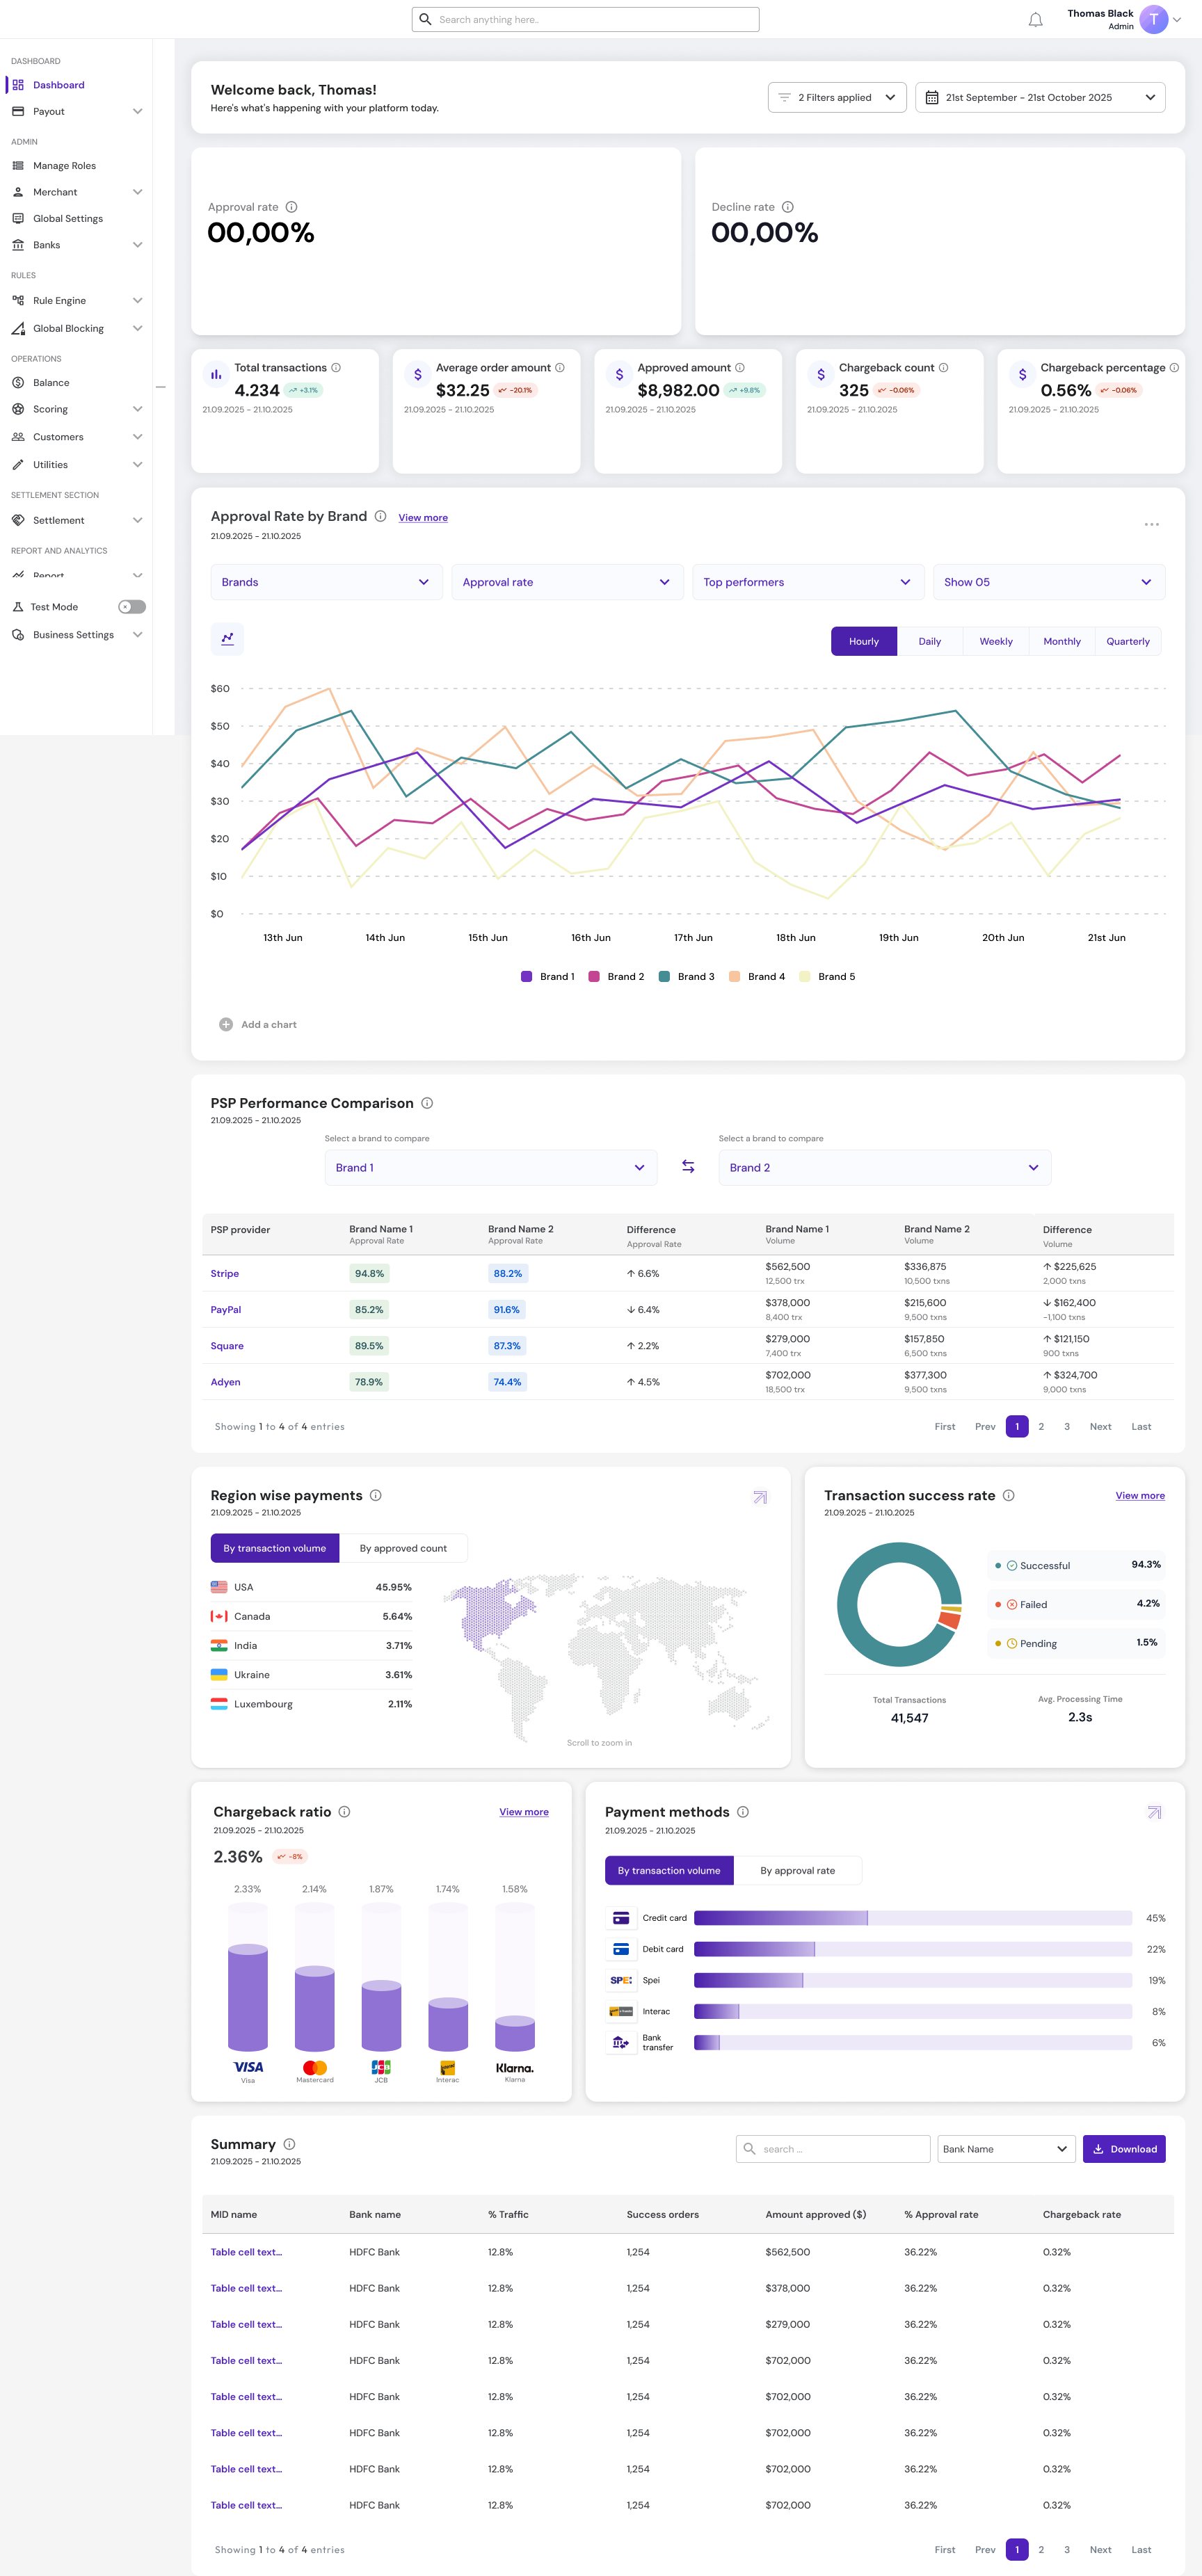
The first version carried more: a provider comparison table with difference columns, a transaction success rate donut, and an approval chart split by brand with five lines and four filters.
06 The rules
Clarity over density, and a library that had to grow
The dashboard brought features the platform did not have, animated components among them. The component library had to be extended to support them before the screen could be built.
The dashboard is live in the React platform.
07 Reflection
What I learned
-
A dashboard is the order of the questions
The old dashboard wasn't badly designed; it answered a different question — how much happened. When approval drops, a payments lead asks a chain of questions: which method, which provider, which market, which bank. The layout follows that chain, from the headline rate down to the MID. That is also the test for what stays: a panel that answers none of those questions is decoration, however good the data in it.